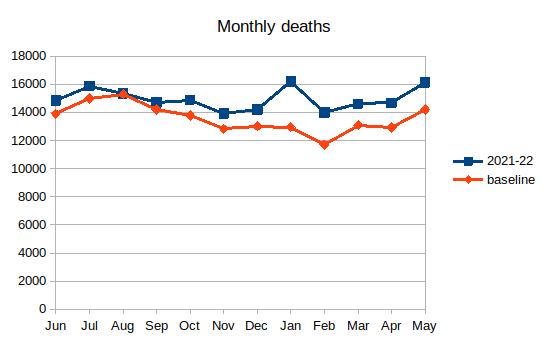
My friend told me he’d heard Australia’s death rate this year has been abnormally high. Sure enough, the ABS reports here (lots of data here for those who want it):
In 2022, there were 75,593 deaths that occurred by 31 May and were registered by 31 July, which is 10,757 (16.6%) more than the historical average. That included 4,465 Covid deaths and the overall population increased 3-4%1They’re comparing with the average of 2017, 2018, 2019 & 2021, omitting 2020 because it had an abnormally low death rate. For 2021, they compare it with 2016-2019.. So why did an extra 5,000 people die in the first five months of 2022?
The first two pages of a web search for “excess deaths australia” consist of a number of articles blaming Covid vaccines for many of those death (on generally contrarian websites), the ABS itself and the Daily Mail.
Whenever a statistic is out of the ordinary and we want to know why, we should break it into categories and see if any of them are further out of the ordinary. ABS gives the age breakdown of this year’s deaths. Death rates for younger ages are similar while for 75+ they are much higher, particularly for men.
| Age | 2022 | Baseline | Extra | Extra % | Male | Female |
| 0-44 | 3171 | 2497 | 674 | -1.9% | -1.4% | -2.8% |
| 45-64 | 9103 | 7121 | 1982 | 5.1% | 5.6% | 4.2% |
| 65-74 | 11744 | 9281 | 2463 | 11.3% | 11.2% | 11.4% |
| 75-84 | 20528 | 16159 | 4369 | 22.9% | 25.8% | 19.2% |
| 85+ | 31047 | 24350 | 6697 | 20.9% | 25.5% | 17.6% |
| All ages | 75593 | 59408 | 16185 | 16.6% | 18.0% | 15.0% |
Next we can look at the causes of death. (I should say at this point I probably know less about medical stuff than the average educated person). Dementia and diabetes have the largest increases.
| 2022 | baseline | Extra | Extra % | |
| Total deaths | 75593 | 64836 | 10757 | 16.6% |
| Total doctor-certified | 66664 | 56699 | 9965 | 17.6% |
| COVID-19 | 4465 | 4464 | ||
| Respiratory diseases | 5051 | 5124 | -73 | -1.4% |
| Cancer | 20686 | 19515 | 1171 | 6.0% |
| Ischaemic heart diseases | 5854 | 5657 | 197 | 3.5% |
| Cerebrovascular diseases | 3713 | 3755 | -42 | -1.1% |
| Dementia inc Alzheimers | 6763 | 5612 | 1151 | 20.5% |
| Diabetes | 2168 | 1806 | 362 | 20.0% |
| Other doctor-certified | 17964 | 15229 | 2735 | 18.0% |
| Non-doctor-certified | 8929 | 8137 | 792 | 9.7% |
Another thing to look at is differences between the states, but after subtracting the Covid deaths there aren’t any big differences except the territories.2First I thought I was onto something because the eastern states, with more Covid cases, had a greater increase in death rate. Then I realised I needed to subtract the Covid deaths and see whether the differences still held. After subtracting the per-state death figures I took from CovidLive, the relationship was the other way. Then I realised the total was 6282, not 4465, and guessed that the former was deaths with Covid and the latter deaths caused by Covid. If I assume the same ratio between states, the recalculated rate of increase in other deaths is about the same between states. In all, messy enough not to deserve a table.
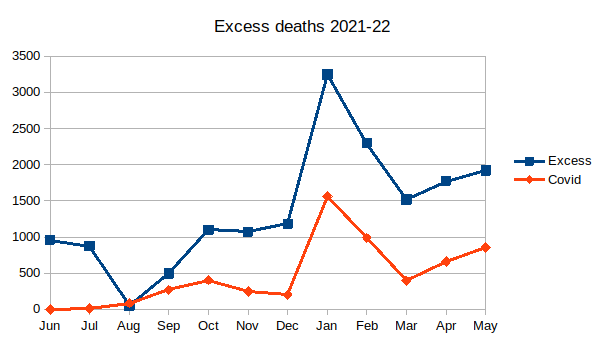
I thought of two hypotheses for the increased death rate. Firstly, hospitals were kept busy treating Covid patients (and had staff away isolating) and so had less capacity for treating all other patients, leading to the deaths of more of them. Secondly, changes to health and aged care systems in response to Covid have reduced their capacity to look after the sick and aged3Including patients avoiding coming for treatment due to extra hassles.. I think these seem to fit with a higher increase for the older age groups, dementia and medical conditions in general. They also fit with January, the peak month for Covid deaths and hospitalisation also having the most non-Covid excess deaths.
Another suggestion I read is long Covid – that many people’s long-term health has been affected by having Covid some time in the last two years and this has led so some people dying earlier. That would fit with higher numbers this year than last. Another thought I had was a rebound effect from the lower death rates in 2020. Others may have better explanations.
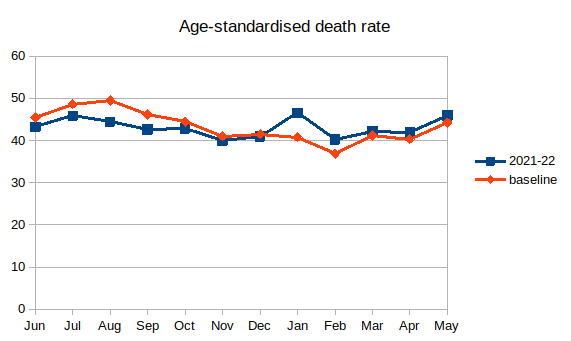
All of the above was written on Saturday and Sunday. Then on Monday morning I looked at the age-standardised death rates (SDR). Early 2022 had an SDR above the baseline, while late 2021 was below it by a similar margin.
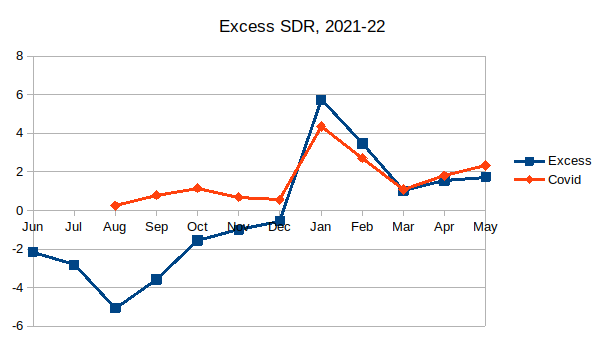
If we plot this excess we find that the SDR due to Covid accounts for most of this excess; in fact for April and May, Covid SDR is greater than the excess. Going on this graph, we might say the case is closed (or wonder why the SDR was so low in August).
So why is the SDR only 6.6% higher when the total deaths were 16.6% higher and population had only risen 3-4%? The answer is that the population aged 75+ grew at a much greater rate, probably increasing by about 14%4Some quick, unchecked calculations using what census stats I grabbed first: Between 2016 and 2021, age 75+ went from 157k to 192k (up 22%), increasing their share of the pie from 6.8% to 8.7%. The baseline years are an average of 3.25 years earlier than 2022, so I’m using 2/3 of the 5-year increase. It might be more, because baby boomers have just started turning 75. Meanwhile, immigration and birth rates were lower in 2020-21, so other age groups grew less than usual.
This, along with Covid, obviously explains why the numbers of 75+ deaths had increased by a large amount and while under 45s were unchanged. It fits with an increase in dementia deaths.
Does this mean my other hypotheses are no longer needed? Mostly. It certainly means the overall death rate can’t be used as evidence for anything else going on. If I’d started with the SDR, this article would have been shorter. I used the raw numbers thinking I only had to adjust by overall population growth.
For the Jan-Feb Covid peak, the excess SDR was more than Covid and that could still relate to the health system struggling. That would be worth looking at in countries that had bigger waves of Covid.
Overall death rates don’t usually show you that much. There may be a whole lot of large increases and decreases that cancel each other out. There will also be causes of death that are very small compared to the total but still deserving of public attention. With all the measures we took to fight Covid, we do well to pay attention to any category on the rise, whether it relates to lockdowns, vaccines, long Covid, different work & travel patterns, mental health, ramping, other hospital issues, aged care etc. We should expect any such rises to be noticed in a relevant category before they make a visible dent in the total.